
Franchise Headquarters Portal
Collects franchise operating metrics by store so headquarters can prioritize support decisions.
- Timeline
- About 5 months
- Team size
- 4 people
- Platforms
- Web · Server
- Scope of management
- Franchise store operating metrics
Background
Headquarters received operating metrics from each franchise store separately, so judging which stores needed more support meant staff compiling reports every time.
Scope
- Per-store operating metric registration
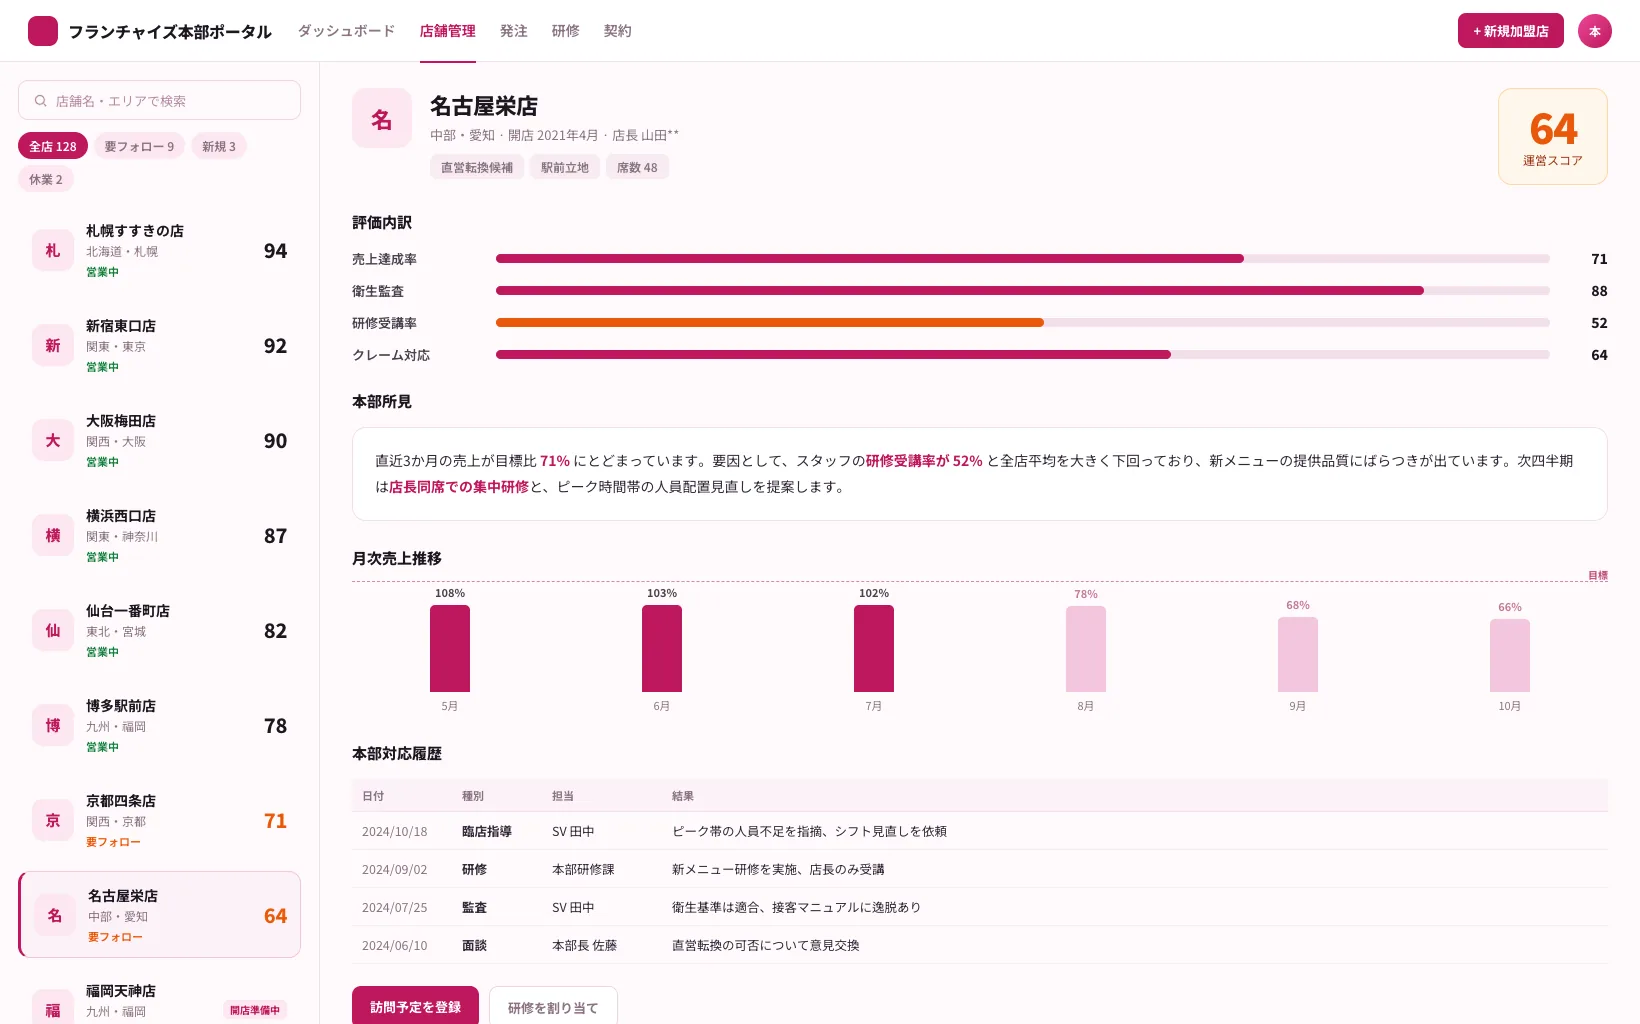
- Unified headquarters dashboard
- Store-to-store metric comparison
- Display of support priority
- Per-store notice and material distribution
Technical decisions
What we chose, and why it fitHad stores enter metrics themselves, with headquarters adding a final review step
Stores knew their own on-the-ground data best, but trusting entries as-is meant input errors would flow straight into the metrics. We added a headquarters review step after store entry, balancing data accuracy against the burden on store staff.
Calculated support priority from a combination of several metrics, not a single one
Looking at sales alone could not distinguish a store that was temporarily down from one that was structurally struggling. We calculated priority from sales trends together with several operating metrics, broadening the basis headquarters had when deciding which stores to support.
Engineering challenges
Problem
Metric entry timing varied by store, so comparing stores on the headquarters dashboard made stores that entered data late look worse than they actually were.
Approach
We showed the last entry time alongside each store's metrics, and flagged stores with no entry for longer than a set period separately on the comparison screen.
Result
Headquarters staff could now distinguish an actual metric problem from simple non-entry.
Problem
Publishing the support-priority criteria to stores risked stores gaming specific metrics, making it hard to decide how much to disclose.
Approach
We separated permissions so stores could see only their own metric trends, while the priority criteria and results were viewable only on the headquarters screen.
Result
Stores could focus on improving their own metrics, while headquarters ran overall priority judgment separately.
Handover and operations
We provided a document on priority calculation criteria for headquarters staff and a metric entry guide for stores, each in Japanese. We handed over the source code and deployment configuration, and supported adding new metric fields under separate maintenance.