
Power Usage Monitor
Tracks monthly power usage and savings target achievement across every business location.
- Timeline
- About 5 months
- Team size
- 3 people
- Platforms
- Web · Server
- Scope of management
- Per-site power usage
Background
Each site only saw its power usage through the month-end bill, so even with a reduction target in place, there was no way to check progress mid-month. Usage spikes could not be caught as they happened, which also delayed identifying the cause.
Scope
- Per-site power usage collection
- Usage lookup by time of day
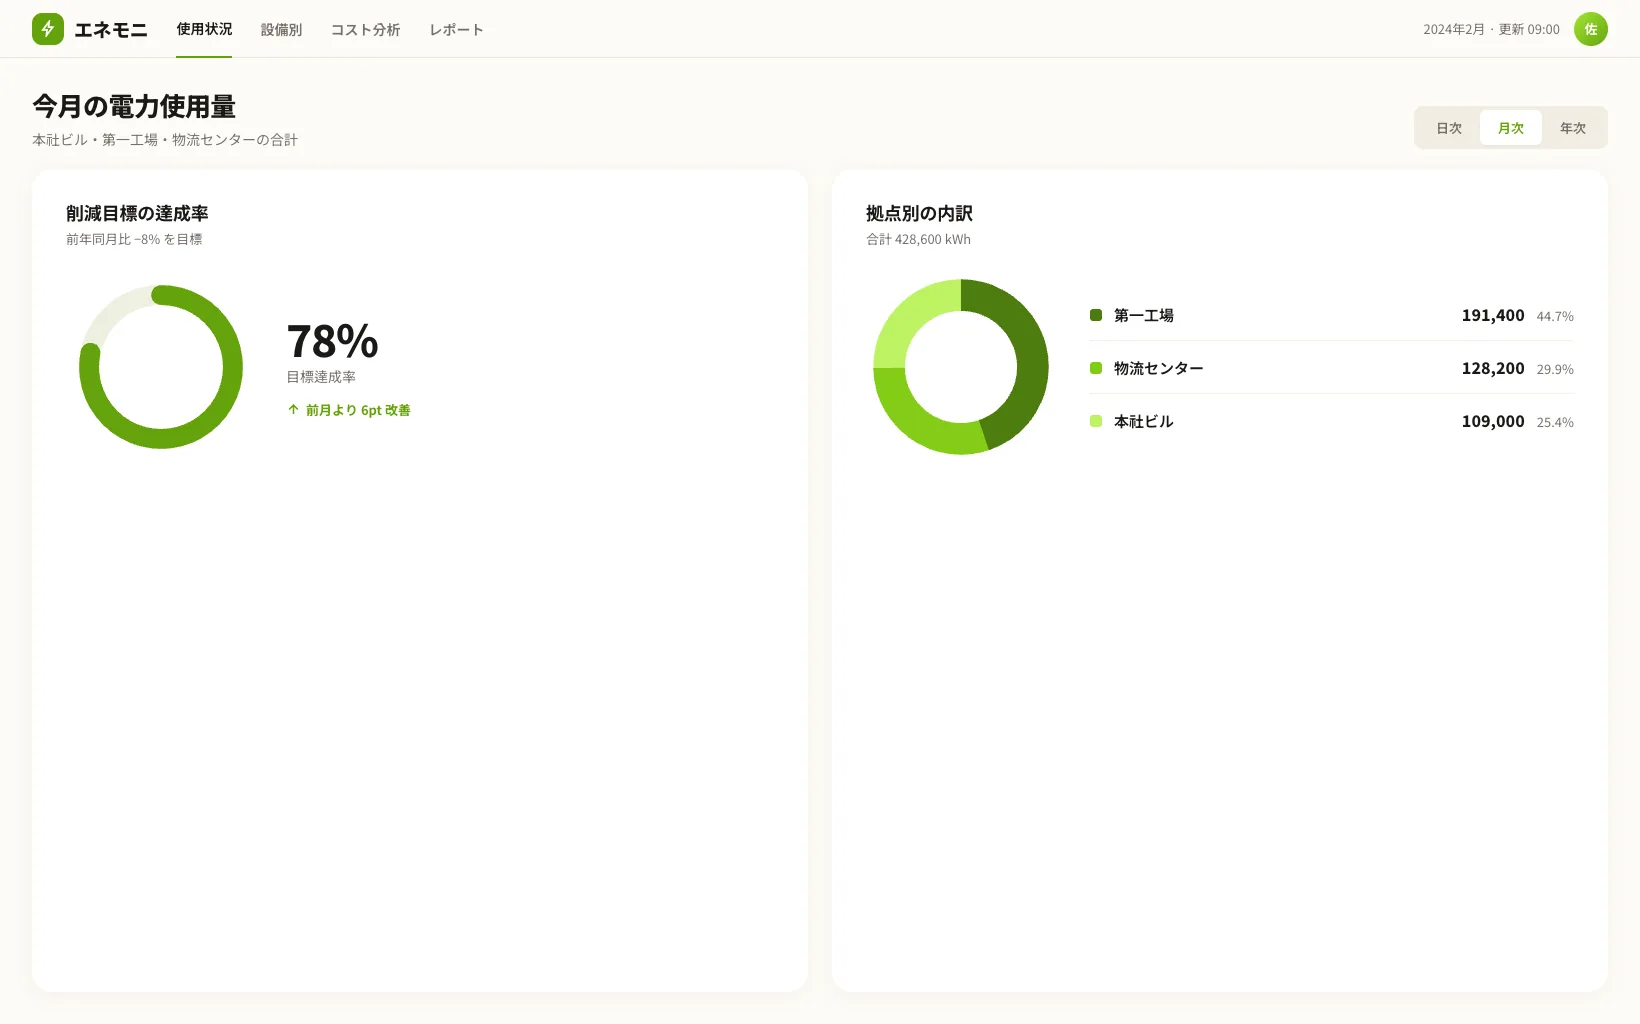
- Display of achievement rate against the reduction target
- Site-to-site comparison
- Abnormal usage alerts
Technical decisions
What we chose, and why it fitUsed TimescaleDB for time-series data storage
Power usage data collected at short intervals per site grew massive over time, and comparisons later needed to span periods — for example, against the same time last year rather than this month. We used a structure built for time-series data to keep period-based aggregate query performance workable.
Showed reduction-target achievement not only as a final monthly figure but also as an in-progress estimate
Waiting until month-end to learn whether the target was met left no time to respond in between. We showed a projected month-end figure based on the trend so far, so a site drifting off target could be caught mid-month.
Engineering challenges
Problem
Meter manufacturers differed by site, so data collection intervals and units varied.
Approach
We built a collection adapter per meter type and standardized storage so all data was converted to the same time interval and unit system.
Result
The screen could now compare usage across sites on the same basis, regardless of meter type.
Problem
When a site's usage suddenly spiked, the screen alone couldn't tell whether it was an equipment fault or simply increased use.
Approach
We built a criterion that compared usage against the same site's usage in the same period previously, flagging it as abnormal only when the deviation exceeded a set range.
Result
Alerts could now distinguish seasonally natural usage increases from abnormal ones.
Handover and operations
We provided a dashboard guide for site staff and a meter integration registration method, in Japanese. We handed over the source code and infrastructure configuration, and supported meter integration for newly added sites under separate maintenance.