
All projects
2025.05Software & InfrastructureNew Build
Infrastructure Observability Console
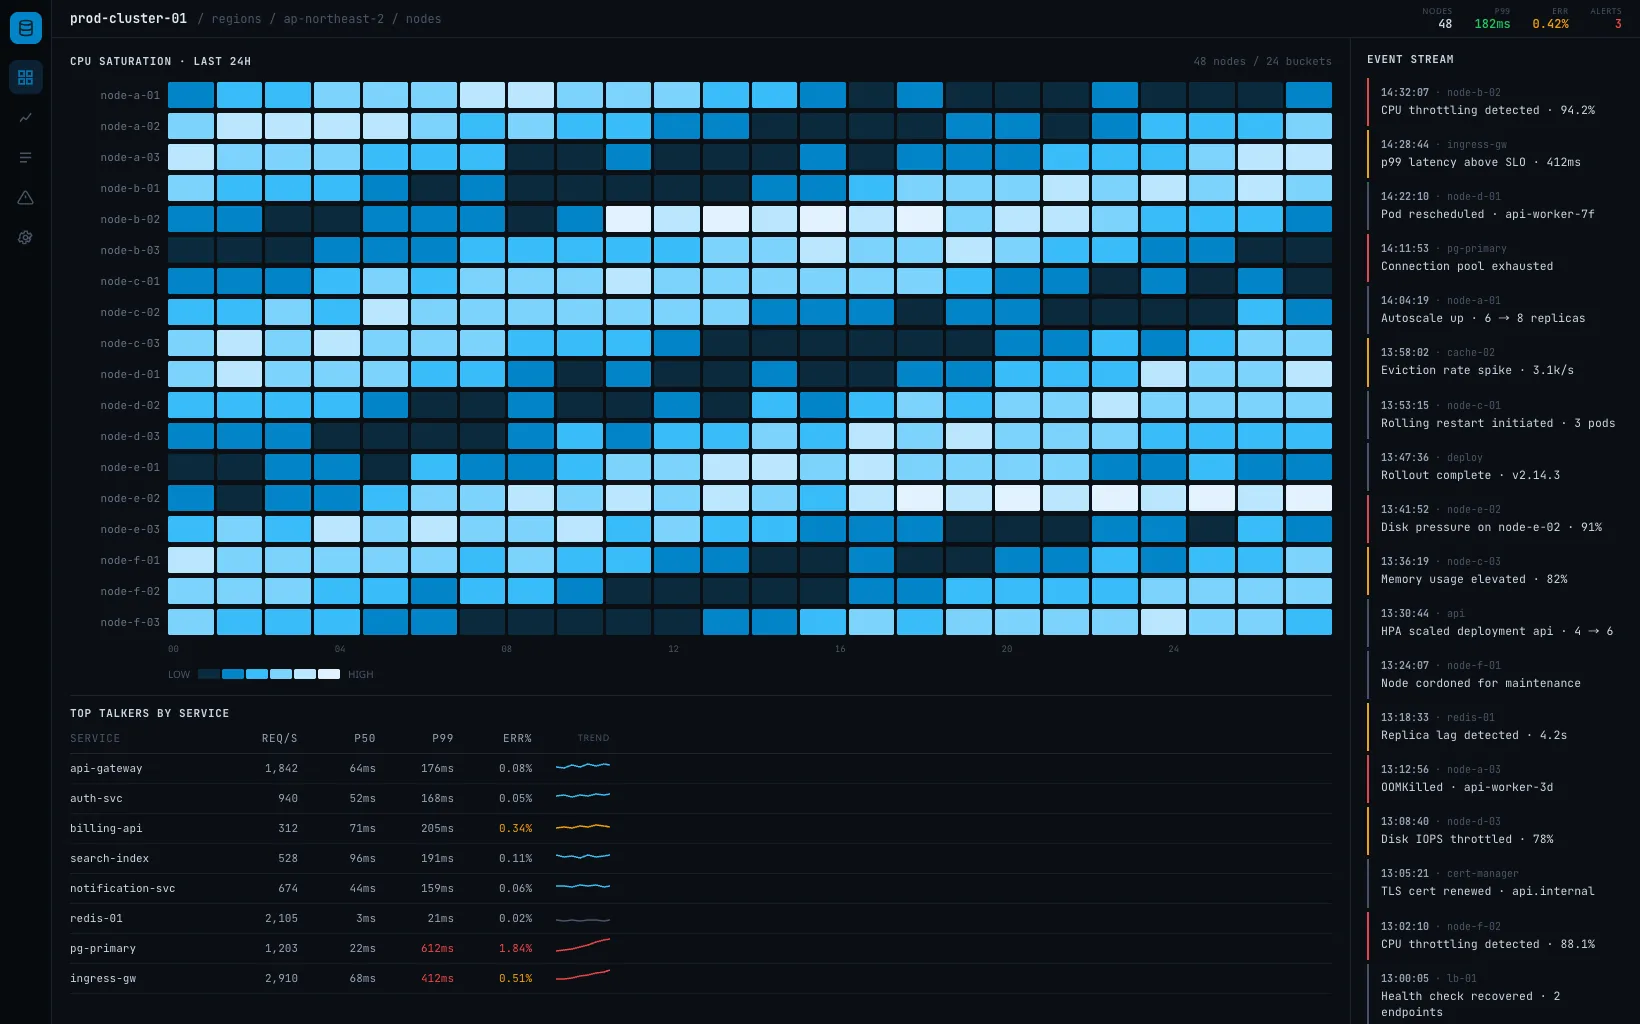
Added observability tooling so load and events across 48 nodes appear on one screen.
WebServer & Infra
- Timeline
- About 4 months
- Team size
- 3 people
- Platforms
- Web · Server
- Scope of observability
- Cluster nodes
Background
As nodes grew in number, the only way to see which node was under load or when a given event occurred was to dig through individual logs. There was no way to scan across nodes from a single screen.
Scope
- Per-node load metric collection
- Unified event log lookup
- Threshold-breach alerts
- Dashboard by node group
- Metric trend over time
Technical decisions
What we chose, and why it fitUsed Prometheus for metric collection, with a Go-based collection agent
In the Kubernetes environment, nodes and pods were constantly created and destroyed, and manually registering each new collection target wasn't feasible. Combining Prometheus's auto-discovery with a lightweight Go agent meant new nodes were included automatically, with no extra configuration.
Stack
GoPrometheusKubernetes